Season 1, Episode 257 · The MongoDB Podcast
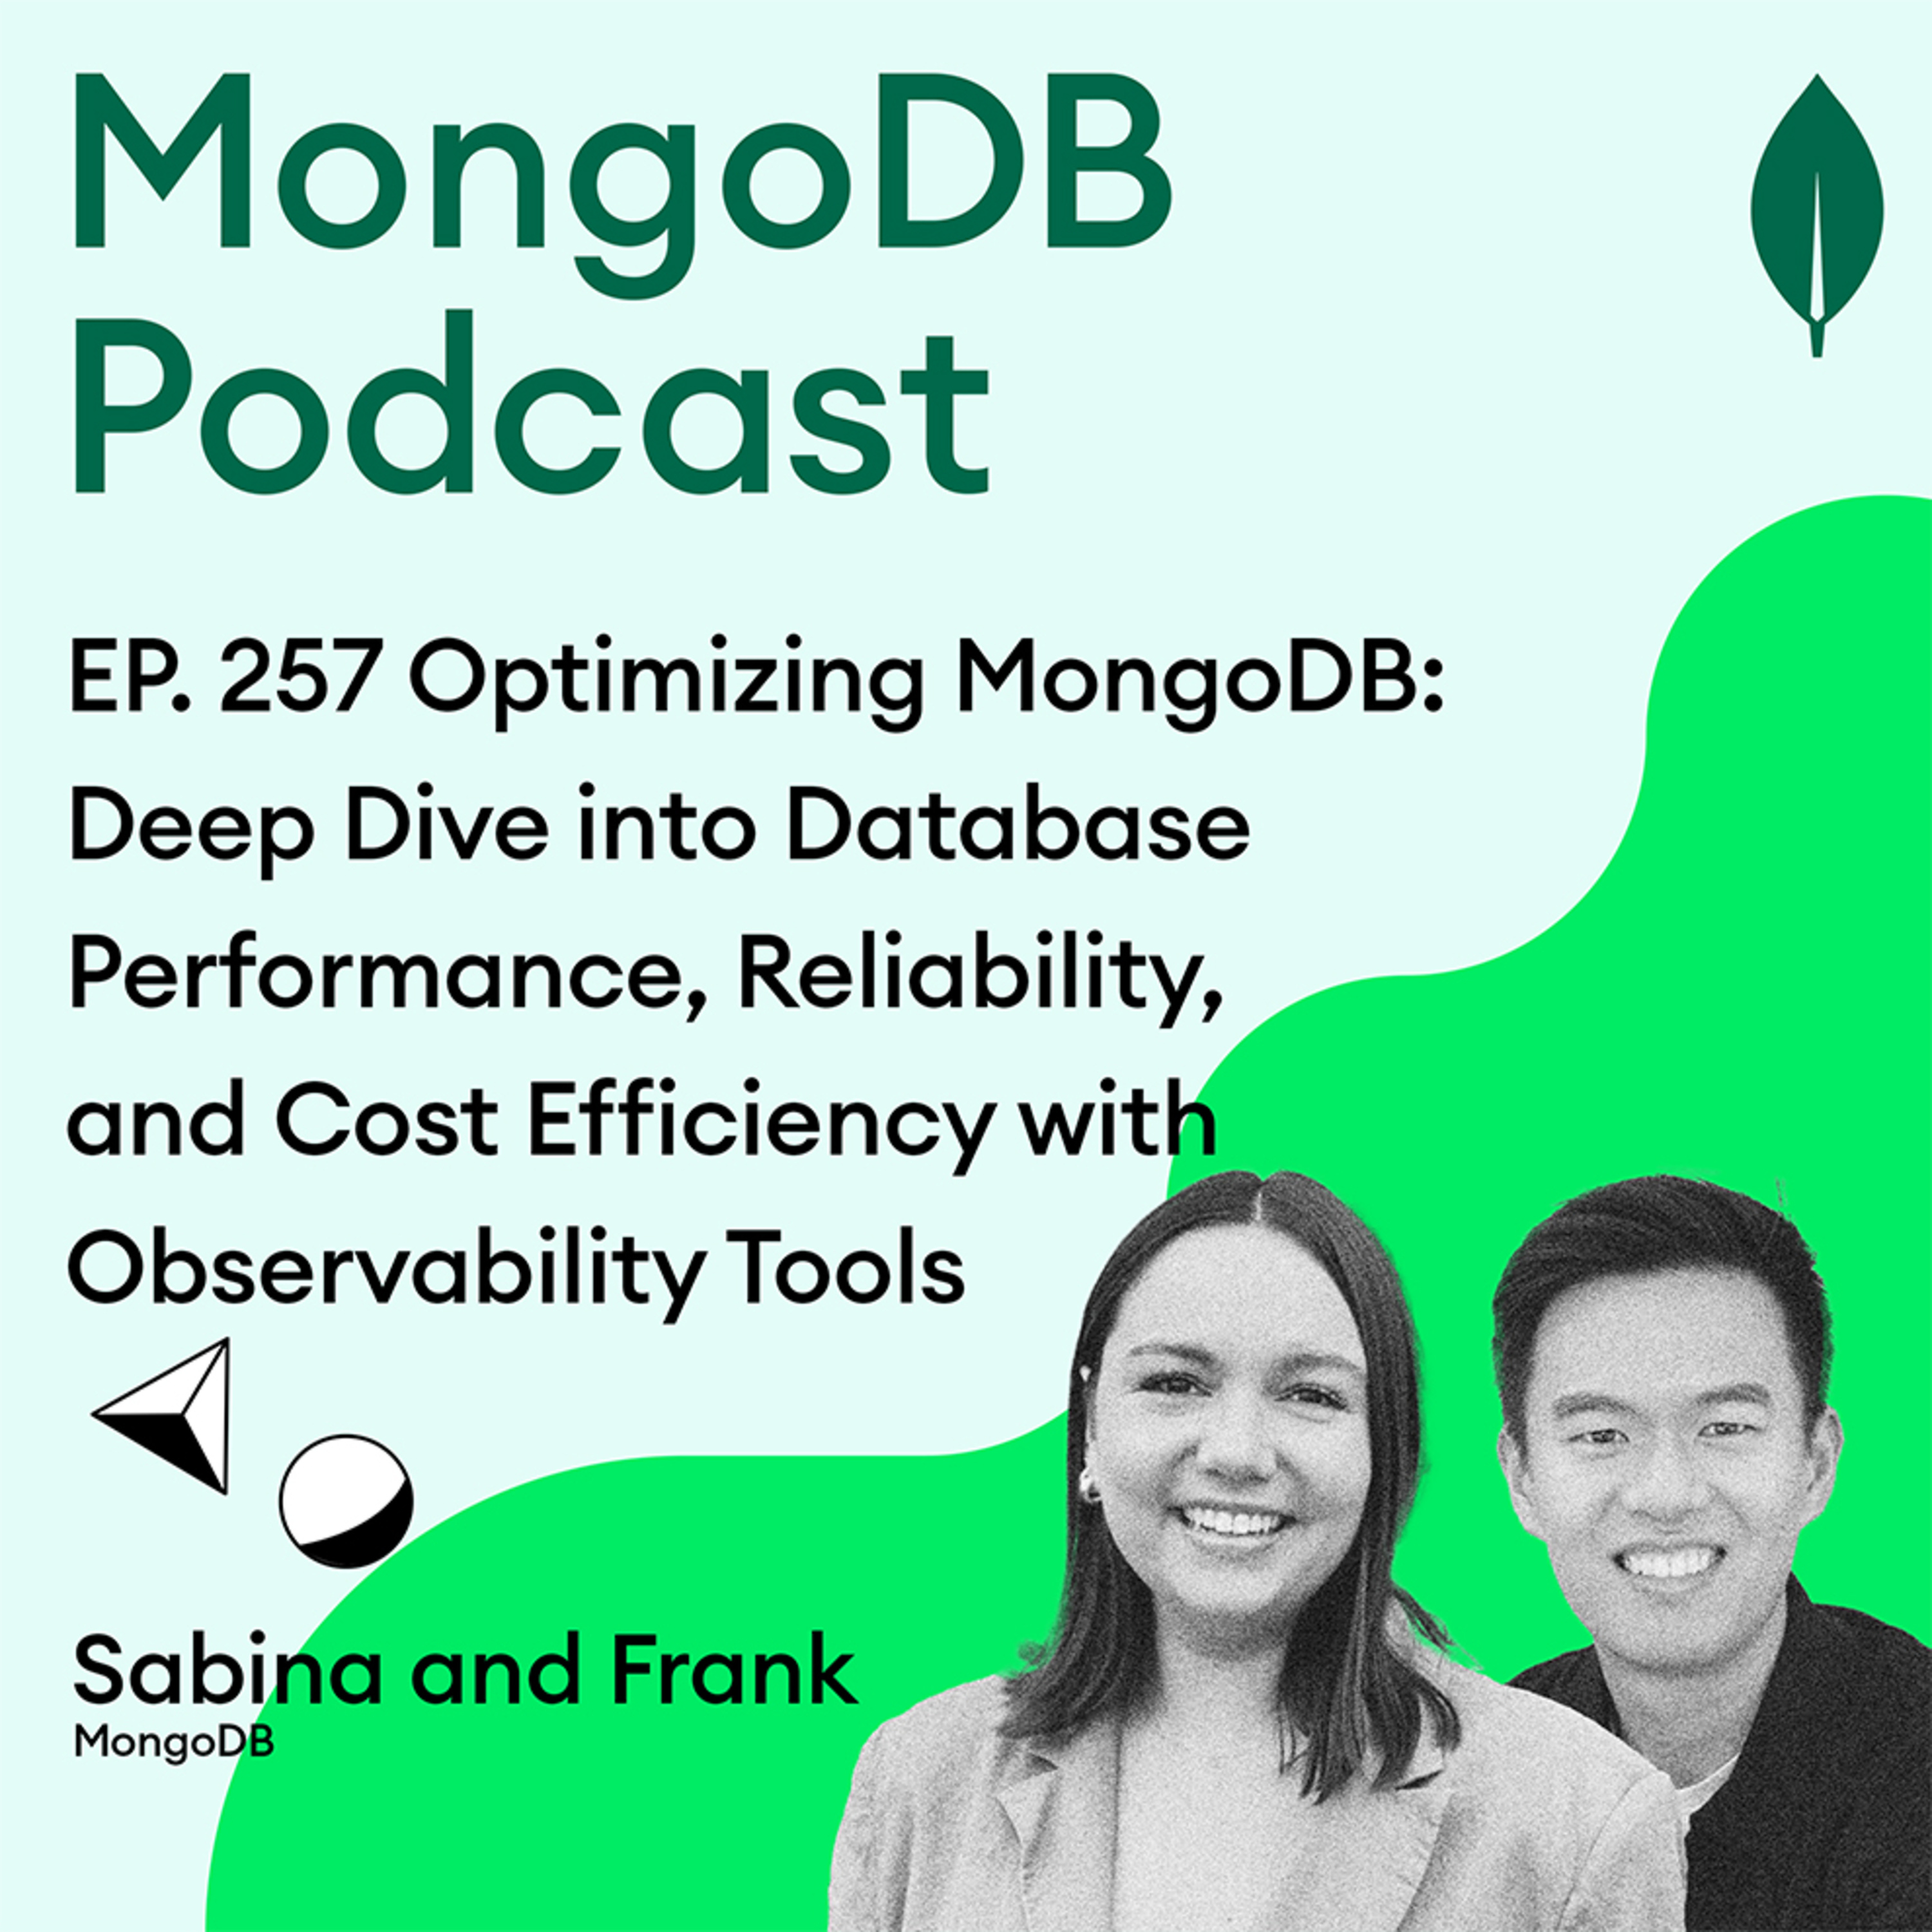
EP. 257 Optimizing MongoDB: Deep Dive into Database Performance, Reliability, and Cost Efficiency with Observability Tools
28 Feb 2025 · 1 hr 6 min
Season 1, Episode 257 · The MongoDB Podcast
28 Feb 2025 · 1 hr 6 min
In this episode of MongoDB TV, join Shane McAllister along with MongoDB experts Sabina Friden and Frank Sun as they explore the powerful observability suite within MongoDB Atlas. Discover how these tools can help you optimize database performance, reduce costs, and ensure reliability for your applications. From customizable alerts and query insights to performance advisors and seamless integrations with enterprise tools like Datadog and Prometheus, this episode covers it all. Whether you're a developer, database administrator, or just getting started with MongoDB, learn how to leverage these…
Hello there and welcome back again to Mongo DB TV. I'm Shane McAllister. I'm one of the leads on our Developer Relations team here at Mongo DB. And today we're going to diving deep into the world of database performance, reliability and cost efficiency. And joining me are two colleagues from Mongo DB, Sabina Fyden, a Product Marketing Manager here and Frank Sun, a staff Product Manager. And so together, today's show, we'll explore Mongodb's game changing observability suite, how it optimizes performance, reduces costs and integrates seamlessly with enterprise tools.
Plus, stay tuned with us for a live demo. We'll showcase how all these tools transform and allow you for full observability and performance analysis of your database. So without further ado, let's get started. Sabina and Frank, you're very welcome both to MongoDB TV. How are you? Hi. Thank you for having us today. No, it's great. Thank. You. I always love to have two guests. It's a certain sense of comfort that one person isn't doing all the heavy lifting.
So I appreciate that. It's great. Before we get started into the details of what we're doing today, I always like to get people to introduce themselves properly, talk about their day-to-day role at Mongo DB, but also, if you can, your path to your day-to-day role at Mongo DB as well too. So Sabina if I could ask you first to introduce yourself properly what you do at mongo DB and also your how you got here. Yeah, absolutely. Like I said, I'm excited to be here today.
So I am a product marketing manager here at Mongo DB and I own our observability suite. Everything that has to do with kind of how we monitored the database, how we alert customers on the database and all of those different features, which is really important to kind of performance and uptime and all of those factors. And what's interesting is I kind of came here because I had the knowledge before I worked at a company called Logic Monitor and they are pretty prominent in the observability space. And so I kind of begun my career there. And with that expertise, I kind of transferred over here to Mongo DB to kind of build help build out our messaging and, you know, our platform for our observe, our observability suite within Mongo DB.
So that's kind of my journey of how I got here and I've been working with Frank ever since I joined about two years ago. And I think we have a great partnership and it's been, it's been a pleasure. Excellent. So you've been here too. You're Sabina and Frank. How about you your your path to MongoDB? Yeah, yeah. Excited to be here. Looking forward to to the event today. I've been here for for about 3 years now. Similar to Sabina, prior to working at Mongo DB, I was also in the observability space. I was working at a a smaller observability startup really focused on kind of like infrastructure and application monitoring.
I was a software engineer there for a few years working on, you know, observability solutions for various cloud services and then transferred over to, to join their product org. And so when I was, you know, when I first started my kind of product manager journey, I was working on integrations between, you know, APM, our APM offering and, and very popular ITSM tools in the market like ServiceNow and Sharewell. And that really got me familiar with things like, you know, ITSM processes and, you know, the change flow of like large enterprises and of course got me, got me, you know, more and more familiar with product management as well.
And did that for a few years and came over to Mongo DB. At Mongo DB I'm responsible for our observability tools which I'm super excited to to showcase today. Excellent. Well listen a wealth of experience there between both of you. It's great to have you on the show. Typically these shows have our our cloud partners and our customers etcetera too. So I really love when we get Mongo DB folks to come on and explain in depth kind of our tools and what we have because it's, I think and this topic in particular is a very much interest to me.
I think lots of our developer community are using Mongo DB, they're leveraging Mongo DB, it's helping them build their applications, it's helping them to do things quicker and swifter. But often, and I've just come back from a week at AWS Reinvent where you meet a lot of customers and developers and users in one go. Often they're kind of have maybe been in the mode of. I use Mongo DB. It's working well for me. It's up and running, it's grand, everything's going fine.
But we always know and the topic of today's show is to deep dive into the performance side of things, but let's set the context. How does performance of your database impact your application performance, impact your application reliability and also maybe impact your costs? So I don't know who to throw that one to first. I don't know if you who wants to take that, but at a really high level, you know, as developers, I used to say developers are lazy, might just do things as quick as we can.
But I've been corrected numerous times, say we're looking for convenience, right? So as developers, we set up with Atlas, we've connected Atlas, we've got our application running, it's working, brilliant job done. But that's not the end, right? So high level contact setting, how does it impact their umm application performance of reliability and costs? Yeah, I can actually take that one because kind of what you're saying, what we've seen is often times, like you said, developers know how do you deploy Atlas and then it's working. But we've seen that there's often times kind of a skills gap with that performance optimization piece, you know, and how can they that really, you know, how can MongoDB really use our tools to impact, you know, database optimization and the performance and how we run.
So that's kind of why we're here today because we have seen that skills gap in the market and we really want to impact power our customers to, you know, understand how they can leverage MongoDB to help with that. But you know, there's really, we have a great how we kind of like to look at it is that we offer these tools from conception. So we are really monitoring your data, monitoring your metrics from conception and we can use and leverage these tools to really give you MongoDB specific insights into your data and how to optimize on that, how to help with resource utilization realization, you know, making sure everything is running smoothly, getting ahead of the issues before they impact any sort of performance or lead to downtime, whatever it may be. So we're really just trying to empower our users on how they can, you know, be proactive in that method, you know, in that method.
Excellent. Anything to add to that, Frank? Yeah, you know, I think Sabina hit it head on the nail. One thing I just want to add is I think one of the beautiful things about Mongo DB and the non relational method is just, you know, how widely adoptable it is from, you know, small startups and just, you know, it's it's quick to get started. And that's one of the, you know, obviously selling points of the non relational model, but it's also widely adopted by some billion dollar industries and billion dollar enterprises.
And, you know, on both kind of ends of that scale, you know, it, it works well, it works perfectly. And I think one of the nice things about Atlas is that Atlas is that, you know, we do make that kind of convenience back there very obvious for our users. And we have a number of tools built in that not only kind of show you like how your database is performing, but we give you very targeted guidance and support on how to, you know, optimize your database performance.
And obviously that ultimately impacts your application performance. It, you know, impacts the the reliability and resiliency of your application and ultimately your bill and your cost as well. OK. So we're going to, obviously, as I said in the introduction, we're going to have a demo later. Let's keep it to the high level at the moment. So we have the Mongo DB observability suite. How long has that been around and how did what have been some of the recent additions to that as well too that we'll see a little bit later? Frank, do you want to take that one? Sure.
Yeah. So we're, we're going to be the, the Mongo DB observability suite has been around since its conception. It's been kind of a day one feature of Mongo DB Atlas. Observability is such a core part of, you know, just maintaining the availability of your database. And so it's something that we've, you know, we've included since day one. That being said, we've continually added more and more features to our observability, observability suite. What may have kind of started as just, you know, baseline monitoring with just pure metrics and alerts.
We've kind of advanced from there. And we've, you know, provided more detailed analysis, looking at things like query profiler, which you can use to really kind of take the symptoms that you're that you're seeing within your metrics data to kind of pinpoint a specific root cause. And we've also added more advisory tools that provide things like index advice and things like schema advice, ways to kind of optimize your your query performance. OK. And is the is the help that's you know offered through the observability suite that's obviously as you said, it's been there since day one with Atlas, right. It's been around for a long time, but is it informed by the the many thousands of customers that we have? So whilst be it that this is your data and this is your instance of Atlas etcetera as well too. We've learned through all our huge amount of customers and developers that are using MongoDB, I suppose the the common things that we should be looking at somebody's data in terms of performance, scalability. And you mentioned it there, I suppose, advising how things could be better and more
streamlined, right? Yeah, absolutely. We're constantly keeping a, a pulse on what, you know, what customer needs are and kind of what the gaps are there and kind of like what their requests are in terms of understanding their data. And the tools like getting more kind of what we, we introduced a tool called Query Insights last year and that was heavily based on kind of our larger enterprise needs. So we're always, you know, evolving with kind of customer demands and customer needs and really fine tuning the tools in which we offer so that they can understand their data better, so that they can, you know, work with their data better. So it's all about meeting them, you know, where they are and what kind of requests they, our customers may have. And we meet with them, you know, regularly to kind of hear feedback.
And once we, you know, we launched, like I said, query insights and there's been very positive feedback because it really was in tune with what customers were kind of asking about. Yeah. And one of the things that we, we like to emphasize as well is just, you know, actionability. You know, every signal, every alert that we, that we provide, you know, we try to make them actionable so that, you know, even a database administrator novice can kind of, you know, see what's going on in the database And they, they have some idea of what to do.
And, you know, where to kind of like connect the dots to ultimately be able to, to, you know, resolve the database problem. Right. What are the, what are the typical kind of metrics or insights you, you mentioned there that the novice database user like where are they starting off? What are they most concerned about? Performance, speed, reliability, costs maybe as well to to kind of, you know, what are the extra levels that you know, observability can bring? Once we get past the general metrics that most database users are concerned with, what, what the insights do we give them? Yeah.
Well, I guess starting from the metrics themselves, there are a number of metrics that we kind of focus on when we're when we're observing a typical, you know, cluster deployment. We kind of break it down into a few categories. Obviously there's the, there's the hardware, there's the CPU, the memory in the disk space, etcetera. And you know, that's, that's all you know. The standard stuff that you'd expect, yes, yeah. Right. Yeah. The other one that we also put a focus on is more of our kind of like query or like database level metrics.
So of course we have metrics like, yeah, obviously the number of like collections, the number of indexes, number of, you know, databases, etcetera. Yeah, those are all kind of indicative of, you know, how much workload you're running on your on your database cluster. But then also we have metrics like our query targeting or query efficiency metrics. And that's really where, you know, we start to get into some of our advisory tools and how those kind of fit in.
So query targeting is, is a metric that we look at often when we get in, you know, when we see a database problem, that's a measure of how effective your queries are. It's essentially the number of documents scanned over the number of documents returned per query. We have that at a few levels. We have that at, you know, the host level. That's kind of aggregated across all the queries running on that host. And that's a good, that's a good kind of starting measure of seeing how effective your queries are.
So if you have, if your queries are scanning a large number of documents and only returning a few documents, that's pretty indicative of a inefficient query. And that might be a signal that, you know, maybe there's a missing index or maybe there's some sort of like schema optimization that that could be that could be optimized. So typically, you know, one of the flows that we see is, you know, if customers do have like a high query targeting value, one of the, one of the tools that we like to suggest is our query profilers. So they can look at some of their slowest queries. And we typically see some correlation between, you know, inefficient queries and slow queries. And they can go into the query profile and they can see specific slow queries and be able to, you know, get more details about, you know, what the specific query is, the execution time, whether or not it's an index scan or a collection scan.
And then, you know, from there we provide additional advisory tools. You know, we, we, if it is a, if it is a collection scan, we'll take a look at, you know, how many documents it's scanning, how many documents it's returning, the average execution time, the number of bytes read. And we'll actually suggest an index recommendation to help optimize those queries. OK, it's ideal. So I'm leaving obviously, look, we're talking, you know, particularly for consumption models, right?
You're talking about, you know, compute. There's a cost for compute, there's a cost for bandwidth, and there's the cost for obviously storage as well too. And so we're looking at that compute time, as you said, if you do a large scan in a query and you return back a very few results, you you can advise there as well too. What are the other types of scenarios that you see, I suppose commonly amongst people before they get deep down into database observability? What are the, you know, what are the common mistakes, as it were, right?
Yeah. Well, I think even before we get down into, you know, some of the database and query level metrics, you know, we talked about kind of the hardware, you know, the hardware metrics earlier auto scaling is something that you know, is built into to Mongo DB Atlas. And that's, you know, pretty a pretty fundamental, you know, observability offering there being able to scale up and scale down based on, you know, CPU and and disk space consumption.
You know, those are those are pretty, pretty standard. But that is something that, you know, we do see some of our customers maybe skip over, you know, that is definitely something that, you know, we recommend our customers enabled just, you know, enabling auto scaling, especially as workloads grow, you know, over time, you know, in this day and age, you know, things can change very quickly, you know, like things go viral and, you know, suddenly application triples.
It's it's it's. Its requirements, it's always a good, it's always a good complaint to go viral, right? But you need the backup behind it in order to accommodate that. I mean, thankfully, you know, most providers such as ourselves are well geared for that. But I'm old enough to remember the early days of something going viral on the Internet leading to things just not working and sites getting errors and four O fours and everything else as well too.
The early days of Twitter was notorious for that with the fail whale and things like that too. But because they were relying on essentially physical servers that they were owned, they hadn't, you know, moved to the cloud at that time as well too. So in regards to what you've described, Frank, and I'm assuming that like we have customizable alerts for all of this Sabina that when you see something happen, you're going to get notified swiftly and how do they work and and how customizable are those? Yeah.
And that's actually, it's funny that you brought that up right then because I was going to say and to add on to that, the general question is how can customers be alerted, you know, about types of situations when you know CPU is running high or whatever it may, whatever the problem may be. We actually have over 200 event types for alert that custom that are extremely customizable. So we kind of we have out-of-the-box alerts that are just kind of like the general recommendations of what customers should be getting alerted on. But beyond that that customers can set thresholds for what they want to be specifically alerted on. So any of those issues that kind of Frank just listed before we can set very specific thresholds and alert customers within Atlas, but also we have this great piece where we can integrate our alerts with customers current alerting system.
So whether that, whether that they want to be alerted on Slack, whether they want to be alerted on pager duty, we have that ability to push alerts into customers tools that they're already using. So that's a really, I think helpful piece for customers because it's, you know, they don't have to, they're already using Mongo DB, they might already be using Slack or pager duty. So it's unless transition into getting informed and notified into what that issue is and getting ahead of it as well.
And in a similar fashion to what other integrations do we have with regard to central observability then, Sabina? Yeah. So that's a great question and that's something that's kind of one of our, you know, good value differentiators is that we are able to offer some really prominent integrations into tools like Datadog, into tools like Prometheus. And we can send push metrics into like I said, tools that our customers already are, are already using so that there's a single pane of glass in which they see it. We kind of look at it and the way Frank and I kind of talk to it, it's a plug and play experience, you know, so Atlas offers these metrics and we are monitoring within. In Atlas and you can troubleshoot within Atlas, but if you want to troubleshoot that within your own application monitoring system, you're able to do so with that integration piece that we offer.
So that's really helpful. And we've seen a lot of value through kind of pushing those metrics to those central enterprise observability tools. So the goals of these alerts and these thresholds and the integrations that we have too are the fact that you have plenty of Fair warning as to any potential issues with the database itself as well too. We got a question in from. Sorry Sabina, go ahead add. To that and just understanding the data in a platform that you already know and that you're already comfortable and you're familiar with, I would say is another benefit of that as well.
Yeah. No, that makes perfect sense. Got a question in from Eric about just expanding on the database profiler if we can. Thanks in advanced, Eric, and thank you for the question. Eric, I suppose we're probably going to see a little bit more in your demo shortly, Frank too. But is there anything else high level we can add about the the database profiler for Eric? Yeah, at a high level, you know, our database profiler, our query profiler, and Alice as it's called, basically just looks at the slow query logs.
So to get a little bit kind of into the details and how it works, there is a database profiler that basically profiles or looks at slow queries over a certain, what we call a slow execution threshold. There's a slow on that threshold. And so any operation that takes longer than a certain slow like millisecond threshold will get profiled into, you know, a slow query log essentially. And then we the the Atlas query profiler basically reads from that slow query, slow query log and displays it as a scatter plot. So in Atlas, as I'll show later in my demo, we have a tool called the query profiler.
It's, it's really just looking at all the slow queries that are running on your cluster and it's presenting that as a scatter plot. And then you can look at individual, the data points and you can click on those and you can see additional details about each slow query. And like I mentioned earlier, it'll show information like what namespace it's running on the database, the collection name, it'll show some client metadata information like, you know, what application it's is, is, you know, calling the query if there's a username associated, you know, we'll, we'll also include the username. It'll of course include things like the query details itself, what the actual command is, what the operation is. It'll also include some execution stats like number of documents scanned, number of documents returned, whether it's a collection scan or an index scan. You know, essentially meaning whether it's not, whether or not it's using index and things like that. Yeah.
OK. OK. I think while you were chatting then Paul, who's obviously very quick at typing, added another question then with regard to this. So his question is, does the profiler show the impact of shards and performance stats? An increased approved locality for a query within a single Shard, or increased latency for a query that spans shards? Would that be something we'd touch on then? So the query profiler does work across sharded clusters. We do provide stats on so depending on kind of like what level you look, you know when you look at it from a cluster level, we are kind of aggregating the the stats across the entire sharded cluster. If you do want to kind of zoom in and look at, you know, a specific Shard or even a specific host, we have additional filter options.
So you can look at, you know, the Shard and the host level and just see operations against that kind of scope. OK, excellent. Thank you for your question Paul, I hope that helped. So we talked about performance and we're talking about getting those deep insights. Talk to me a little bit about cost then, because obviously the end goal for some sides of the business is to make sure increased performance also leads to reduced cost. So how, how does it leverage the observability to understand how we do and, you know, maximize resource usage whilst also reducing costs if possible? Who wants to grab that one?
Sabina, Frank. Whichever. Yeah, I keep. You could go ahead, Frank. OK. Yeah. So one of you know there are multiple ways that we kind of optimize cost, but the one I want to focus on is the performance advisor. So we kind of touched on it earlier, but our performance advisor, one of the the main benefits of performance advisor is the index recommendations. Our index recommendations and performance advisor also based on our slow queries. So just like our query profiler, we're looking at any operations that are run against the cluster that take longer than a certain, you know, millisecond threshold.
That millisecond threshold, by the way, is also kind of dynamic based on the workload running on your cluster. So let's say, you know, your cluster has many slow operations all over, let's say 150 milliseconds. Our slow Ms. slow milli, slow millisecond threshold will dynamically adjust to look for operations over, you know, let's say 100 milliseconds or so. But if you have pretty well optimized queries, or let's say you have, you know, queries that that just don't take a lot of time, maybe they're very kind of efficient queries. And your typical workload is seeing maybe let's say like 50 millisecond queries, you know, are we're, we'll dynamically adjust again and we'll look for slow queries that are like over 30 milliseconds or 20 milliseconds. So the, the, the slow queries that we're looking at on your cluster are dynamic based on the workload on that cluster. But to get back to our index advice, we are looking at the slow queries on your cluster and we're looking at, you know, things like the number of documents scanned, documents returned, obviously execution time, average bytes per per collection per document.
And we're running an algorithm in the back end that basically looks for or suggests an index. And then we'll do some kind of processing in the back end to see the expected performance benefits of that index. Our index advice today is limited, so we don't provide index advice on aggregation pipelines. It's, it's just on, you know, queries. But that is something that we're looking at for for the future. OK, OK. I guess just to, I guess just to put it simply, I think when queries are optimized, the the database engine can retrieve the data more quickly with less consumption of effort and that can lead to lower, you know, resource consumption ultimately, Yeah. Cool.
Quick question for Sahil. And can we optimize aggregation pipelines for better performance? Do we take care of that as well too, or is that elsewhere? Yeah. So not in the performance advisor today, our performance advisor today the index recommendations do not suggest indexes for aggregation pipelines. We do have some tools in our in our data explorer that do and as well as Encompass that do give kind of better feedback, better statistics on aggregation pipelines. So I don't have a ton of information about that, but I would definitely recommend checking out Compass. You can use it to kind of build aggregation pipelines and see how each stage of your aggregation pipeline is performing.
You know, you can kind of break down the, you know, the, the pipeline as well and get stats about each, each stage. So that it would be my recommendation. Excellent. So Hill, thank you for the question. And I love that you mentioned Compass. I think it's something that we don't shout enough about. It's an incredibly powerful tool essentially to examine and look at all of your collections and do the aggregation pipelines and a whole host of other things in there. So if you're using Mongo DB Atlas and you're not don't have Compass downloaded, go get it.
You'd be amazed at the insights that it can give. So there's the plug for Compass. I want to get into kind of the show part of this. But before I do this, one of the things and again we have a wide developer audience on the on the Mongo DB TV is to just like give a context of scale. Like people are building a Mongo DB to do their proof of concepts and their MVPS and we've got customers which are absolutely enormous financial institutions, etcetera.
So is there, is there any limitation to this scale at which the database observability tools work? Like if you have many, many, you know, hundreds of thousands of documents and, and you know, many, many thousands of reads and writes per second, etcetera as well too. Is there any limits on on how you know that can be observed using the tools that we have? So we've actually been working over the past year to optimize our advisory tools for our largest customers. And as you mentioned, yeah, we have billion dollar financial services enterprise customers as well as, you know large gaming companies all with, you know, multinational presence. And so we see that actually part of their kind of regular workflow is looking at some of our core profiler tools and looking at our index recommendations. And they actually bake it into kind of their like daily or their weekly database administration workflow. And, and it's something that they're using, you know, every day.
So it does work for, you know, of course both the POC as well as those enterprise level skill. OK. So it covers that wide range, which is enormous, right? There's quite the range of users on who are optimizing our tools. Excellent, excellent. So we've talked about a lot, right? We're going to see some stuff in action. We talked about obviously Performance Advisor, the query insights, the metrics charts, the customizable alerts and and some of our integrations.
So I think people want to see it in action. So Frank, if you want to share your screen, I saw a little bit earlier, if you're going to show on the live stream today, it'd be great to, you know, have a run down to this to put it into context for those that may not be so familiar with the tools that we have to hand in Atlas Net. So. Perfect. That's coming through nice and clear, and hopefully everyone else can see that as well too. Perfect. Yeah, so I have the Atlas cluster here and I have some workload running on my Atlas cluster.
I'm going to just go over briefly, you know, some of the tools that we talked about here today. I'll spend a bit more time on some of the new things that we added this past year. We talked about the query profiler, you know, we've made some happens to our performance advisor, but just to kind of level set and make sure we cover everything, you know. So our metrics page here, here I'm running A2 Shard cluster. So yeah, I can see kind of an overview of each of my two shards and and I can see specific metrics about each of these shards.
So earlier we talked about things like documents returned, documents scanned, and here I can see the number of documents returned for each of my shards in my 2 Shard cluster. If I want to get additional detail, I can also click into one of my shards as well. So I'll click into my Shard 0. Here I can see, you know, these are my Shard level details. Here I can see additional metrics as well. You know, we talked about some of our hardware related metrics earlier, but we have a number. Yeah, we have a number of different metrics available here.
You can also see additional information about, you know, what each metric means. We also have things like common server events like server restarts or re elections. And that is helpful because you can kind of contextualize how you know different metric behaviors or you know how the metric is behaving may be impacted by server events. These are all, you know, highly interactable as well. You can zoom in, you can zoom out, you can set custom time windows. We also have metrics for search nodes as well. So I am running a search workload on on this on on this cluster.
And so I can see, you know, how my search nodes are performing. I have, you know, 2 search notes here. But going back to my, my Mongo D, you know, data bearing notes here, you know, we, we took a look at, you know, some of the metrics that we have available as well as some of the interactions on this metrics chart. The, you know, I also want to show off, you know, some of our alerts. So we do have a number of project alerts as well that are available out-of-the-box once you get started with Atlas. And of course you can add new alerts as well. So you know, if I wanted to, you know, add a new alert, I can, I have a number of alert conditions that I can alert on. I can specify it for specific hosts. And as Sabita mentioned earlier, we are super plug and play with a number of, you know, observability and notification tools in the market.
So, you know, if I wanted to create a Datadog monitor or if I wanted to, you know, page someone and page your duty or if I wanted to notify like a Slack channel or notify, you know, someone in Slack. These are all out-of-the-box notification options that we have available. We also have. And so there's nowhere to hide basically. You can't, you know, once you've set these things up and added all your integrations, you can't possibly say I didn't know about it, right?
And. You're supper going to know about it. Yeah. We also talked about observability integrations earlier as well. So you know, we have a number of integrations here, but you can see we also have Prometheus and Betadog here. I actually have Datadog here configured. We also have a number of integrations that are not shown on this page that you can find through our partner portal with popular APM tools like New Relic, Dynatrace, Grafana Cloud, etcetera.
So pretty, you know, pretty well integrated into the overall observability market. But getting back to, you know, some of the tools that I want to highlight here. So we talked about our metrics. That page there, the query insights page is the one that we recently introduced this year. So what I'm looking at here is our namespace insights. This is essentially providing metrics at a collection by collection level. So earlier we were looking at metrics at, you know, the Shard level or at the host level.
Those are aggregated across all collections, across all queries per host or per chart. And so there is a level of fidelity that you kind of lose there when you're looking at things from that kind of like aggregate view. And so this namespace insides view provides a bit more of a detailed view and provides a bit more kind of data fidelity. So here I can see, you know, I have a few collections. It looks like I have a credit cards that secondary deleted cards collection that is taking on average around 25 milliseconds per second to run its queries on that collection.
And it's, it's, it's a lot higher latency than than the the rest of my collections. And so that could be something that, you know, maybe I want to look into. We're able to look back seven days on this Namespace Insights page today. So I just started running my demo script earlier, but you can see we had a pretty significant spike in latency. We can also look at the number of operations run, you know, per collection as well. We're looking at a number of different collections.
I'm just looking at kind of my top five here. But if you do have, let's say like a specific collection that you know is very critical to your workload, you can also pin that collection here as well. And so you know, if we let's say the deleted cards, sorry, my keyboard disconnected. Proper live demo. There we go and let. Me see, was it primary or secondary? It was secondary secondary deleted cards. So if I wanted to, let's say pin my secondary deleted cards collection, I can pin that here. And that way I'll always be able to see my secondary deleted cards collection, even if it does kind of drop out of my top five in terms of, you know, total, total execution time. OK.
So if there's something you're particularly keen and observing you, you pin it basically. So it's always there, even if it is performing adequately. That's right. Yeah. Yeah, sorry, I was just laughing. I have to turn it off and on again. Comment. Yeah. Thank you. Right, Connect live, yeah. So, you know, one thing that we've noticed, you know, customers, you know, really use this kind of pinned namespace feature for is, you know, if they are, let's say, onboarding a new workload, you know, typically, you know, we may see that they, they create a new collection and then they start, you know, you know, importing documents and start running queries against that new collection. If, if they're already running, you know, an existing workload on, on their cluster, it may take some time for that new workload and that new collection to kind of show up on this page because, you know, it is kind of sorted by total execution time. And so this is one way that, you know, especially for new workloads, that may be something that you want to kind of keep a closer eye on and make sure you know, it kind of scales up accordingly to plan.
And also maybe keep an eye on other critical workloads that you know, maybe are more business critical. And you want to make sure that, you know, any new workloads maybe don't impact existing workloads. These are the the pinned namespace is a is a great way to kind of keep your eye on those things that really matter the most to you. Sure. So from here, the next level fidelity that we're dealing with beyond the the namespace and the collection is, you know, the the query level details. And we kind of touched on this earlier. This is the scatter plot that's showing OK, individual query details.
These different colors kind of represent the different namespaces or different, you know, collections that these operations are run on. And then the Y axis here represents our execution time. But we can definitely change this as well. You know, by default, we're typically looking at execution time, but you can also take a look at, you know, operation response plan. If you can take a look at documents, examined documents returned the the ratio as well. So there's a number of different dimensions that you can kind of view your slow operations based by. And if I do want to see, let's say, you know, one specific operation, click on this dot, they'll kind of highlight that dot and we'll be able to see some just high level stats about this operation.
Say kind of, I can see, you know, the namespace it's run on the, the timestamp obviously has the X axis. I can see what Shard it's running on since this is a 2 Shard cluster. And you know, I want to, you know, I do care about what Shard it's running on and what host this operation is running on. I can see some, you know, high level metrics here as well, such as the, you know, operation execution time, whether it's a collection scan or not. And I actually couldn't, it looks like this operation actually is a collection scan if it has a sort stage as well as the operation type. Again here, you know, I'm only looking at a few a few collections here, but you know, if you had multiple collections, you could also kind of sort and select different collections that you're interested in.
But this operation that I highlighted here is actually pretty interesting. It's, you know, it has a collection scan, it's taking 360 milliseconds. So it is, it is quite slow. I'm going to jump to this button here. I'm going to view a bit more details. And this is where, you know, I think the pre the query profiler really shines. It's, you know, we're able to see all the previous executions of this, of this operation. We're able to see, you know, the one that I just clicked on here as well, but I can see the actual log document, the actual query details.
And this is where there's just, there's a wealth of information here. You know, we kind of touched on it earlier, you know, we're able to see the actual command here. We're able to see, you know, some information about the database here. There's further down below here. You know, here's some of the client metadata that we talked about. So we can see, you know what, what driver we're using, We can see the application name here. We can see that it's a collection scan.
And so this may indicate to us that there's some index that we may want to create to kind of cover this, cover this query and you know, make it more efficient and you know, ultimately improve its execution time. Here we can see the number of documents examined. So we're actually examining 25,000, sorry, 250,000 documents and, and returning 0. So that's not a great query at all actually. And then, you know, there's, there's a number of, you know, other, other metadata that we can look at here as well.
We can see the the execution outside the, the execution time in milliseconds here. And so, yeah, this is definitely a query that we want to further investigate, you know, that we may want to, that we may want to optimize. And so this is where performance advisor comes into play. So if we scroll back up here and we look at our performance advisor. It's great to see the time stamp in history because you could have a query that was working perfectly fine up until the point and all of a sudden it's taking forever. So you're able to track back and say, well, you know, when and how did this happen, right?
Right. Yeah, definitely. Yeah. Being able to look back at the query profiler here and look back, you know, up to five days. So you're really able to see, you know, kind of the history of your queries and how that, you know, some of the, the trends that kind of happened over time. You'll notice here I'm, I'm looking back five days, but I only really started my my demo script a while ago. But you can see here we have these like bigger kind of bubbles.
One of the strategies that we've recently introduced this this past year. And again, this kind of goes back to your question earlier, Shane, about how we kind of scale for those large enterprises, those large enterprises are running, you know, huge workloads, you know, with, with, you know, hundreds of thousands of collections and hosts. And you know, they're, they're huge deployments and their, their workload is, is, you know, really high scale. This is one of the ways that we have improve that query profile to handle those that level of scale. Previously we were showing, you know, each operation as an individual dot and of course you know, that started to run into limitations on just, you know, the browser performance and stuff.
And so the aggregation, the basically what these bubbles represent is an aggregation of operations around a similar timestamp on the same collection of a similar operation type. And so I can see here, you know, this is this big bubble here represents, you know, like Monday at a certain hour time period. And it's representing like 4 point, almost 5000 operations of, you know, around the same time stamp and the same operation type. And if I wanted to zoom in, I can just click and drag in here and it'll dynamically just, you know, the groupings here.
But here, you know, I can immediately I'm having more fidelity, I'm starting to see some of these outliers here. And you know, I'm able to see a bit more kind of the, the trend and the pattern of my query of my query workload. Again, I can zoom in further and you know, at a certain point, you know, this is where now we're just showing individual query stability and we're able to look at individual queries. But this is one way that we've kind of scaled our tool to work both for, you know, the kind of lower levels of scale as well as that high enterprise level of scale.
Yeah, it's incredibly powerful and the the granularity that you have once you dive down into it is is brilliant, I suppose to try and figure out, you know, what was that? So yeah, that's brilliant, but great explanation. So what's next on the performance advisor stuff? Is it? Yeah, Performance Advisor is the last one I want to touch on here. And again, you know, for people that are familiar with Performance Advisor, this may look and feel pretty similar.
One thing I want to touch on as well is that this past year we've also made some improvements to Performance Advisor kind of more under the covers. For anyone that was kind of previously familiar with Performance Advisor, it really only worked on a host by host basis. And so, you know, you would have to go to a specific host and then you'd have to see, you know, the index advice for that host. And you kind of have to do some kind of manual correlation to see how you know, you know, how the index advice or what index advice you had on the other hosts.
What we've done now is we've now aggregated it at the cluster level, including for sharded clusters. So here I can see, you know, my demo script is only running operations on a single host here. But, you know, we do have the ability to look at index advice for, you know, either a specific Shard or a specific host by default, you know, if I don't have anything selected, it's essentially aggregating all of the slow queries across the entire cluster and giving you the index recommendations across the entire cluster. So this is one index recommendation that I can see here.
I can see it's on my transactions dot credit card info collection, and it's giving me the actual field that I would, you know, want to create this index on. It also gives me a some additional information as well, such as, you know, statistics that I might expect if I were to improve the queries that are, you know, that would benefit from this index. I can see if there are any other indexes on this collection. In this case, it's just a default no under score ID index and it gives me some samples, you know, sample queries that might be improved by this index as well. So, you know, if I wanted to take a look at the in a specific log line here again, I could see like, here's a, here's a specific slow query that would benefit from from this index. So from here, you know, if I wanted to just create this index from this page, I easily could, you know, if I wanted to, you know, go back to my CLI or, or do it some other way, you know, I could easily do that as well.
But for for my purposes, you know, I just want to, you know, performance advisors telling me to create this index. I'm just going to create this index here and you know, it's going to bring up this model. It's going to have everything already filled out for me. I can just review it and kind of go through the process and it's going to start building that index. Building index will kind of take take a little while, but once that index is built, I should be able to then go back and look at, you know, my, my name spaces. I should be able to then go back at my name spaces and I should be able to see a pretty significant, you know, improvement inquiry performance for that for that collection. And so, you know, if I did want to actually take a look at my index, I think it was on my credit cards collection, if I remember correctly, actually, I don't remember what collection I created that on.
That's no worries. Go back and check my activity sheet there. But but yeah, in any case, on on the collection, on the collection I created the next time I will start seeing some some performance improvements. Brilliant. I love the the thumbs up, thumbs down on the performance advisor suggestions, right? It's a, it's a nice way to go. We obviously are are getting the feedback from that as well too as as people use it right. Yeah. We've been continually improving our index recommendation algorithm as well, based on the customer feedback that we've gotten from from this page.
OK, OK. And so for what we have there on the on the got create index as we went through that improve schemas then Frank what will that do? Yeah. So this is another, this is another advisory tool that we provide. So we, we provide, we, we look at your 20 most active collections on your cluster and there are a number of anti patterns that we're basically looking for. So here, so here I can see I have one active, if I have, you know, a significant number of indexes on a collection that can actually degrade your, your write performance.
So there is kind of a balance in terms of, you know, how many indexes you want. You don't want duplicative indexes, you don't want indexes that aren't being used. You know, all of those can kind of impact your write performance. But you do want indexes that you know do improve your queries and are actively being used because that, you know, ultimately improves your read performance. And so there is kind of a balance there. What the schema, what we call our schema advisor, what our schema advisor does is looks for anti patterns such as these.
So here I can see I have some unnecessary indexes on my scheme advisor dot call to action collection. And so if I wanted to click on that, you know, bring me to my collection, I could take a look at my indexes here. And yeah, I have this is this is a lot of indexes and I can see, you know, they're not really actively being used. And so I really should kind of go through it. I should delete some of these indexes. Just going back here to my scheme advisor again, there are a number of other anti patterns that we look for as well.
So if we see, you know, as an example, if we see a number of dollar look UPS, that that's an anti pattern that we also that we also kind of, you know, surface to users, that could be kind of indicative of a more relational pattern to looking at data. And that, you know, a large number of ballot look UPS can kind of degrade your your query performance because it's looking across multiple collections. And typically, you know, we want data that's kind of queried together to kind of be stored together.
And that, you know, that's just one way that we kind of improve query performance. Unbounded arrays, unnecessarily large documents, too many collections in in one database and the use of dollar regex or dollar text, uh, when you know dollar search could suffice. You know there are a number of these other anti patterns that we surface, umm through the performance advisor as well. Excellent. So it's great, great to see. I know and, and obviously there's more involved than just the developer relations team, but we do design reviews with our clients and we've got a really, really expert team that does that.
But the amount of times that it would be like, did you not look in performance advisor to understand a little bit about the things you could have done before we sat down opposite the table to talk to you about this. So these set of tools are amazing with regard to database observability. Is there anything else to show here, Frank, while we're in here? So that is done right. Yeah, that that we've gone through most of them. Those are the the two main ones that I wanted to highlight there. We do have a number of exciting new additions coming to Atlas as well.
You know, we kind of touched on, you know, the namespace level or the collection level granularity. We touched on the per operation level granularity. One thing that we've introduced in Mongo DB7 dot O is this new aggregation stage called query quick dollar query stats, which provides telemetry or you know, metrics at a query shape level. So that's another kind of level of fidelity that we see really works well with our developers. That is something that we're going to actually be investing in in the new year is providing query shape level fidelity within Atlas as well.
So that I think will have a very close correlation with, you know, the actual workload running on the cluster. And that's a great way that we, you know, we see resonates well with with engineers and with developers. Excellent. So watch this space more more to come. We, we've gone through metrics, we've gone through the alerts, we've gone through the integrations obviously, and the, the query insights and ended up with performance Advisor as well too.
We've covered an awful lot in a relatively short space of time. Sabrina, where can people go to learn more if they want to get started with our database observability tools? Yeah, absolutely. We have a number of resources available to users. We have very comprehensive documentation, but we also provide a learning bite. And within that, that kind of goes through all of the different tools, kind of the value of what we just talked about. And then we kind of go through a live scenario of, you know, like an e-commerce shop going through the issue and kind of, you know, troubleshooting at all the different tools. So the Learning Bite is an awesome resource for users to look at as well.
And then we have. I know we've got a longer URL right which nobody's going to be able to copy. But if they go. To learn.mongodb.com they can search for. It they can search for it, It's in the title. And then also we have a series that Frank and I actually recently just worked on. It's a three-part series, blog series that we kind of go through. We go through kind of the tools and then the second post is kind of like a real life use case of how how we conduct basically the demo that he just did in real life. And then the third is kind of on integrating with the different tools and kind of walks through a scenario on how we can, you know, how like Slack converses with Datadog and how those tools kind of intermix as well.
So there's a number of resources that users can kind of look into to see. And again, if you go to the developer center, Mongo DB's developer center, so developer.mongodb.com will get you there and then just search for observability. And search being what it is, should surface up your your articles straight away and that as well too, so people can go there and try and check things out as well too. There also was a video that was done at dot Local. So dot local is Mongo DB series of events that used to be just key cities.
We've now taken it to over 20 cities around the world. We're just finishing. I think we've got, is it Zurich or somewhere? Somewhere's finishing at the moment. I think maybe, or maybe it's already done, but you did a video as well too. So for those that can type quick or screenshot quickly, you can get straight to the video there, but just go to the Mongo DB YouTube channel and search for it as well. You'll get to see that, right? Yeah, you, you can see Frank give that live, live demo as well.
So it's a great, it's a great talk and kind of dive into like patterns and on performance and much more, much more of Mongo DB Atlas as well on that speech, so. Perfect, perfect. So look, we've covered most of the topics. There's been a couple of questions along the way. We've tried to answer them on the fly. If anyone else has some questions to ask before we should I please drop them into the chat either on YouTube or LinkedIn really quickly. I'm looking through the questions.
There's no particular questions. There's it was basically telling us we should do Q&A and but he doesn't have a question for us. But thank you for the hint. Definitely will do. But you were so kind earlier to say that Mongo DB rocks. We do appreciate that. That's going down really well. Paul, who did have a question for us earlier had to drop. So to kudos to you Frank for the, the great demo there as well too. So if anyone has any final questions, we'd be on for another little bit to be able to answer those. I suppose with regards to what you've been building and what you see when you're talking to our customers and where you're trying to interface with the engineering teams and building things that typically kind of is there anything that surprises you that developers using MongoDB aren't observing, for example, that you kind of go, why aren't you even doing this? Is there anything come up in the past that's been left you scratching your heads, Sabina?
And I think for me, it's just kind of the general consensus that they don't even know that these tools exist to help, you know, that's, and that's kind of what I was getting at at the beginning was we've noticed that there's, you know, we, I see, I kind of listen in on some customer calls and I'll notice that there's just like a general, you know, consensus of like, oh, I didn't even know that. We have, you know, a performance advisor to give us index recommendations. And kind of what you were touching on earlier was like that's often times we direct developers and customers to look at these tools and something, you know, often times they don't even know that it exists.
So I think that's that's kind of what I've noticed in terms of, you know, the gap. OK. And Frank and. Yeah, I just wanted to highlight, you know, what Sabina said. Yeah, I, I think awareness of some of these advisory tools is really one of the the gaps that we've seen. What we see with our kind of most successful customers is that they do kind of build, you know, reviewing their index advice, reviewing their scheme advice and their query profilers into their kind of, yeah, at least weekly workflow.
You know, some of our largest customers, as I mentioned earlier, you know that their DBA teams are looking at this regularly and. You know, there are strategies that we've kind of also introduced earlier this year that we're going to continue to invest in next year to kind of make these a bit more accessible as well. You know, we've kind of seen that a lot of our customers that are using the Atlas console, you know, will will kind of gravitate towards the the overview page.
And so, you know, we've been thinking about ways that we can kind of bring these, you know, index advice and schema advice insights kind of earlier into, you know, the developer journey and, and earlier into, you know, their kind of user experience journey as a way to kind of highlight them more. And we we have seen some pretty good success with some of those initial experiments. Google, yeah, yeah. And even as per your example, Frank, having, you know, multiple indexes, you know that the uninitiated think of add lots of indexes, things are going to get better.
But as you say, there comes a point of diminishing returns there and and I suppose that's one of the things that we see generally when we're talking to developers as well too. You're kind of going, you know, look at what you're doing as I think, Sabina, I think you mentioned it earlier, maybe it was Frank, you know that the the mantra Mongo DB is that the datas that access together should be stored together. So whilst you know, some people have notions that, you know, non relational databases are schema less, you still need to think about how you, you know, design your data, how you look at that, what you're trying to store together, what you're trying to keep, how you're going to query that.
What scale is that going to get to at a certain stage as well too. I think these are all plenty of really, really good questions before you start out. But even if you haven't, I suppose, and this is probably the main tenet here is if you haven't thought of any of this stuff, then go in here and use the tools that we've made available to see what's going on with your data. And to you know, you know, it's probably an eye opener, right? Yeah, absolutely. And like Frank has mentioned, just incorporating it into kind of a weekly admin task or you know, your weekly cadence of checking in on, you know, performance. And I think it can be highly beneficial when users are kind of checking in in a weekly basis. Yeah, and that's probably a key take away from this is to not neglected incorporated into, you know, your weekly routine of looking at things.
Anything else to add as a final part in comments? I'll go to you, Frank, first on on all of this and what we've covered and and you know, any other advice to developers leveraging database observability? Yeah, I think my, my final thing is, yeah, as we touched on earlier, you know that the regular cadence I think is one part. But also I think, you know, treating observability as kind of a post production step I think is also, you know, an anti pattern that I've seen as well.
I think, you know, observability, database observability should be something that is kind of considered from initial inception as you're kind of on boarding, as you, as you know, you know, you're instantiating and and increasing your workload. These tools are things that we should be looking at, you know, kind of continuously, not just once we've reached kind of a production state. You know, these index advice, you're sorry, the index advice, the schema advice, these are things we should be looking at as, you know, we're developing, as we're kind of onboarding our workload.
And I think at the point where, you know, we treat it as just a post production activity and I think, you know, it's much more expensive and much more impactful to make, you know, certain changes. Yeah, it's kind of. The from the start and yeah, sorry, go ahead. Yeah. No, it's kind of the carpentry analogy. You know, measure twice, cut once. You know, get in there 1st and think about this from the beginning and don't just set things in motion and say, OK, we'll go in and retrospectively, maybe fix them or see what the slow bits are etcetera as well too. I cut across you there.
Sabina, do you do something else to throw in there? Yeah, no, just like it's available from the start. And this is kind of, yeah. Also another thing we've kind of seen is that often times it is, you know, customers are kind of looking at looking at it as a post production state. But I think getting in there and starting from the beginning, from conception of your deployment as well as and that kind of goes back to incorporating it into the routine of just, you know, understanding where your Mongo DB deployment is. Excellent, excellent.
Well, look, we've covered so much. Sabina Frank, thank you so much for I know it was super quick. We went through lots metrics, alerts, query insights, integrations, performance advisor, etcetera as well too. But as we did point out, if you have a blog series up on our developer centre, developer.mongodb.com to go in and have a look at that. And if you are using it and you've any questions, we have a superb community on Mongo DB forums. So if you want have any issues, you want to ask for advice, go to community.mongodb.com to our forums there, Our engineers hang out there, our developer relations team out there and our community as a whole is really good in helping and assisting each other as well too.
So if we've whetted your appetite to understand a little bit more about how your data is doing and how to make the most out of your queries, how to reduce costs, increase performance, at least we're sending you in the right direction there. And we do hope that you get started. But for me, Shane McAllister, and to you, Frank and Sabina, and then to all our viewers who joined and did ask the questions that we went through, thank you so much. Please keep an eye out for future episodes that we have coming down the track.
But for now, on everything to do with database observability. Thank you, Frank. Thank you, Frank. Thank you, Sabina. Thank you. It's been great to have you both. I really appreciate your time. This was super fun. Thank you so much, Shane. Yeah. Thank you everyone. Excellent. Take care everyone. Good luck. Bye, bye, bye.
Transcript supplied by the publisher with the episode.

by MongoDB · English · Tech & Science
Whether you're building your first app or scaling to millions of users, The MongoDB Podcast brings you the conversations worth having. Developers, founders, and technical leaders share how they architect systems, navigate hard decisions, and build with AI.
S1 · E260 · 26 Mar 2025 · 58 min
Ever wondered how companies like Amazon or Pinterest deliver lightning-fast image search? Dive into this episode of MongoDB Podcast Live with Shane McAllister and Nenad , a MongoDB Champion, as they unravel the magic of semantic image search powered by MongoDB Atlas Vector Search ! 🔍 What You’ll Learn : Why semantic search is a game-changer for AI-driven applications (spoiler: it’s all about meaning , not just keywords!). How to transform images into vectors (embeddings) and store them alongside your data —no clunky ETL pipelines required! A live demo showcasing real-time image search on a…

S1 · E259 · 19 Mar 2025 · 1 hr 2 min
🔥 How can AI transform customer retention and drive revenue growth? In this episode of The MongoDB Podcast , join host Shane McAllister and Samir Agarwal , Chief Product Technology Officer at Agmeta, as they dive into the future of AI-driven customer insights. Discover how Agmeta leverages MongoDB Atlas Vector Search and cutting-edge AI tools to predict churn, personalize customer experiences, and unlock hidden value in customer interactions. 🔹 Key Takeaways: Why traditional customer surveys fail—and how AI extracts real-time insights from calls, chats, and transcripts. The role of…
S1 · E258 · 7 Mar 2025 · 1 hr 8 min
Welcome to MongoDB Podcast with host Shay McAlister! In this engaging episode, we dive into the transformative realm of AI in revenue operations, featuring our special guest, Fabio, Senior Software Development Engineer at MongoDB. Discover how AI is revolutionizing rev ops through Mops AI, a tool born from innovative hackathons. Fabio shares insights on leveraging MongoDB's own tools and advanced technologies like OpenAI and Atlas Vector Search to optimize tedious processes and enhance data utilization. Perfect for developers, AI enthusiasts, and tech innovators, this episode offers deep…
E256 · 27 Dec 2024 · 9 min
Join us as we conclude our exciting day at Local London! In this final segment, we reflect on the highlights of the event, including key announcements, insightful discussions, and the innovative features showcased throughout the day. Our hosts share their thoughts on the importance of developer productivity, the impact of AI on various industries, and the future of MongoDB's offerings. Whether you missed the event or want to recap the key moments, this episode is packed with valuable insights and a look ahead at what's next for MongoDB.
23 Dec 2024 · 11 min
In this episode, we sit down with industry experts to discuss how MongoDB is revolutionizing the insurance sector through data modernization and AI integration. Discover how MongoDB's document model simplifies data processing, enhances developer productivity, and reduces friction in application development. Learn about the exciting advancements in vector search and unstructured data handling that are set to transform customer experiences in insurance. Whether you're in the industry or just curious about the future of data management, this episode is packed with valuable insights and…
20 Dec 2024 · 11 min
In this episode, we explore the exciting advancements in MongoDB's Atlas CLI and Docker support with a leading expert in developer tools. Discover how these features streamline local development, enabling faster feedback loops and efficient testing environments. Learn about the integration with existing Docker tools, the benefits of running MongoDB locally, and the future enhancements on the horizon. Whether you're a developer looking to optimize your workflow or just curious about the latest in MongoDB, this episode is packed with valuable insights to elevate your development experience.
S2 · E8 · 5 Jun 2026 · 56 min
Watch this episode as a video on Spotify! In this episode of the MongoDB Podcast, host Jesse Hall sits down with Karthik Kalyanamaran, Co-Founder and CTO of Langtrace AI, to discuss how engineering teams are building reliable AI products. Moving from traditional, deterministic software engineering to the non-deterministic world of Large Language Models requires an entirely new approach to debugging, testing, and monitoring. Karthik shares his journey from scaling observability infrastructure at Coinbase to creating Langtrace AI, an open-source LLM application observability platform built on…
S2 · E7 · 28 Apr 2026 · 15 min
Watch this episode in Video Format on Spotify . Are autonomous agents about to replace your traditional CRM? In this episode, Anaiya Raisinghani (Sr. Tech. Evangelist, AI Startups & Ventures at MongoDB) sits down with Ishan Mukherjee, Co-Founder and CEO of ROX. They dive under the hood of ROX, the world’s largest-scale revenue agent company that is building AI to handle the end-to-end revenue cycle autonomously.Ishan breaks down his founder journey—from Amazon Robotics to Apple's Knowledge Graph—and opens up about the technical realities of building AI agents today.What you’ll learn in this…

S2 · E6 · 21 Apr 2026 · 45 min
Watch this episode as a video on Spotify ! In this episode, Luis Pazmino, Industry Principal for Financial Services at MongoDB, sits down with Saurabh Khandelwal from Capgemini to explore how financial institutions can transform payments data into a strategic revenue engine. The conversation dives into GenPAL , Capgemini’s solution powered by MongoDB’s modern data platform, and how it enables organizations to move beyond data storage toward real-time intelligence, AI-driven insights, and data monetisation . In this episode, we discuss: • Evolving Payments Landscape: Key shifts shaping data…
S2 · E5 · 15 Apr 2026 · 47 min
Watch this episode in video format on Spotify! If you're building Python applications on MongoDB and still writing raw queries by hand, you're leaving a lot of developer productivity on the table. Beanie, the async-first ODM built on Pydantic, was created to fix exactly that — and this episode goes deep on how and why it works. You'll learn how Beanie maps Python objects to MongoDB documents without sacrificing atomicity or performance, why async-first design matters for modern Python stacks, how schema migrations actually work in a document database, and what the deprecation of Motor means…

The Melo app keeps playing with the screen off, works in the car and on your watch, wakes you to your station, and browses the whole catalogue offline. Free, no ads, no account.